Peak |
T site |
Q-type |
Chemical Shift |
Relative |
Peak Width |
Peak Shape |
Assigment |
(topological) | (ppm) |
Peak Area |
(ppm) |
(x)L (1-x)G |
|
C | T1+T2 | Q4(0Al) | -110.70 | 0.497 | 2.02 | 0.180 |
B | T1+T2 | Q4(1Al) | -104.77 | 0.436 | 2.49 | 0.060 |
A | T1+T2 | Q4(2Al) | -99.00 | 0.067 | 2.31 | 0.640 |
References
Spectrum
Spectrum information
| Obs. freq. | 119.2 MHz (Field = 14.1 Tesla) | |
| Pulse sequence | single pulse | |
| MAS frequency | NA kHz | |
| Spectrum | processed by H. Koller, University of Münster | |
| Data processing | Spectrum digitized with WebPlotDigitizer and deconvoluted with dmfit: D. Massiot et al., Magn. Reson. Chem.,40, 70-76 (2002) |
|
| Si/Al ratio | 7.0 (derived from the simulation above) |
Chemical Formula
| |TEBOP+21.57Na2.57| [Al6.0Si42.0O96]-AFX TEBOP+2 = C20H36N2+2 = N,N,N',N'-tetraethylbicyclo[2.2.2]oct-7-ene-2,3:5,6-dipyrrolidinium = 4,4,10,10-tetraethyl-4,10-diazoniatetracyclo[5.5.2.02,6.08,12]tetradec-13-ene SMILES: CC[N+]1(CC2C(C1)C3C=CC2C4C3C[N+](C4)(CC)CC)CC Images: stick 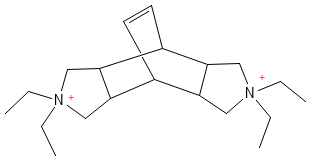 or or |
Downloads
| Download digitized spectrum in JCAMP-DX format (This file includes also the data listed on this page) | Download all lines from the above plot in .csv format (This file contains only the plotted data) |